
Think of the last time you visited a new website. Was it pleasant to browse, or did you have to wait for a long time for even the smallest elements to be fully loaded? Loading times are crucial especially for e-commerce websites, and in a worst-case scenario the visitor’s experience is so bad that they will move on to find another webshop. Seravo’s premium hosting and upkeep is designed and optimized especially for WordPress to guarantee fast loading times by default, but even the most powerful server environment can’t operate under a heavy load.
From time to time WordPress experts at Seravo’s customer service are faced with questions on website performance and speed optimization: how could the loading time of a website be improved? How to measure and test current loading times? In this post, you’ll find an introduction to some of the commonly available tools for testing your website’s speed and identifying bottlenecks of your website’s loading times.

When optimizing your site’s speed, always remember to test before and after any changes!
WebPageTest
Originally created for internal use only by AOL, WebPageTest.org is nowadays developed by volunteers as its own GitHub project. The backend is supported by both companies and individuals alike. If desired, the tool can be run locally on your own machine as well. In fall 2020 Catchpoint “adopted” the tool to back it up, so that the speed optimization community may continue testing their websites reliably.
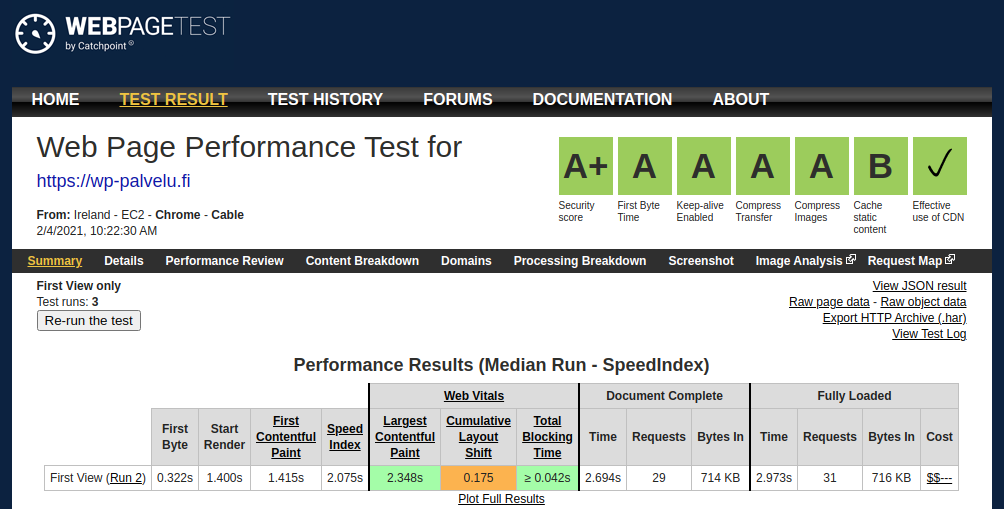
Right after test runs WebPageTest will give out a score for the websites’s performance, as well as Core Web Vitals metrics.
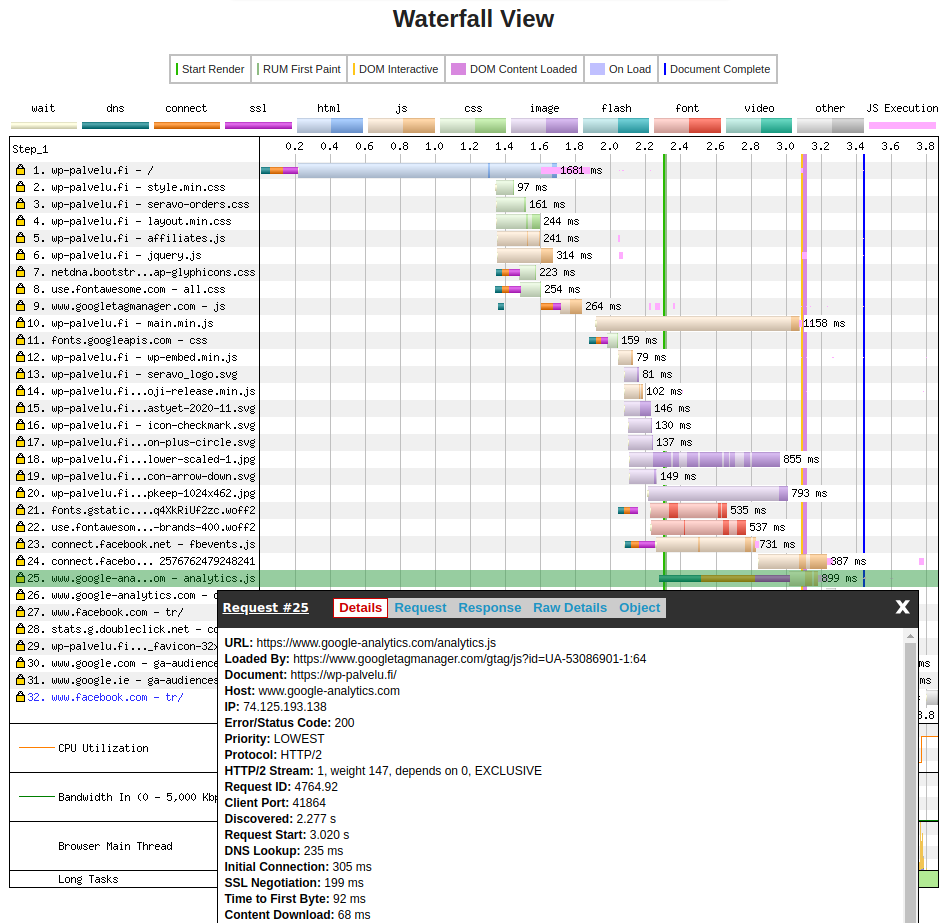
A particularly useful feature of WebPageTest for identifying bottlenecks is the Details tab. In the waterfall view, you’ll see information both internal and external resources loaded by the site. At the time of this test, Google Analytics (google-analytics.com) was responding slowly, so that it took nearly a second to retrieve a file sized less than 50 kilobytes.
Google PageSpeed Insights
https://developers.google.com/speed/pagespeed/insights/
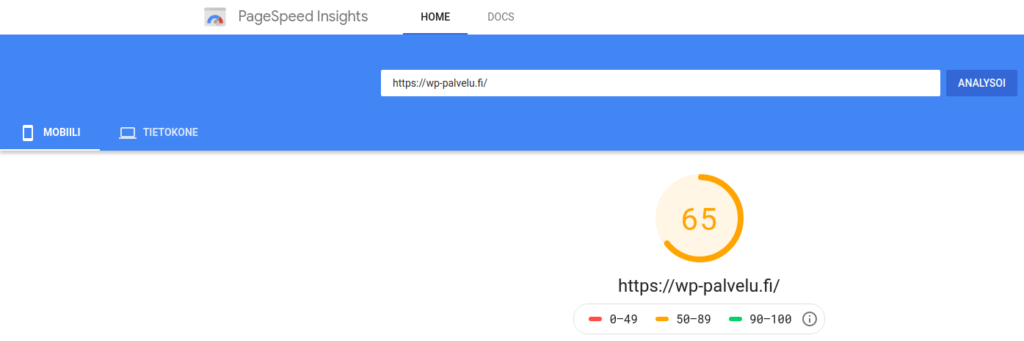
PageSpeed Insights belongs to Google PageSpeed Tools, introduced back in 2010. The PageSpeed Insights tool gives each website a score on a scale of 0 to 100, analyzing the mobile and desktop views separately. Compared to WebPageTest.org, hich is possibly one factor in the large variation in test result scores. In five different test runs, the score given to Seravo’s website used in this example was given a score between 62 and 74.
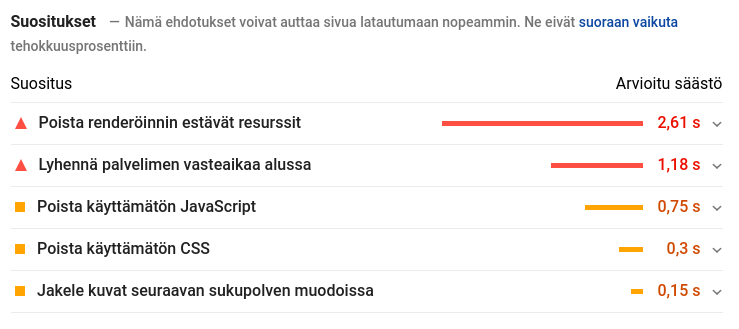
In addition to the score, PageSpeed Insights offers tips for improving site’s performance or user experience. It’s good to keep in mind that not all of the optimizations recommended by the test are possible or worthwhile to be implemented. However, it does offer insight into what ought to be given attention to.
GTmetrix
Behind GTmetrix is Carbon60, a company specializing in cloud services. The service has a paid version, but the free version can also be used for testing. A creation of a free user ID is required to use the service, after which 7 different test locations will be available. Without a username, the tests are always run from a server in Vancouver, which does not necessarily return useful results – at least in the case of a website intended for the Finnish-speaking public and located on a server in Finland.
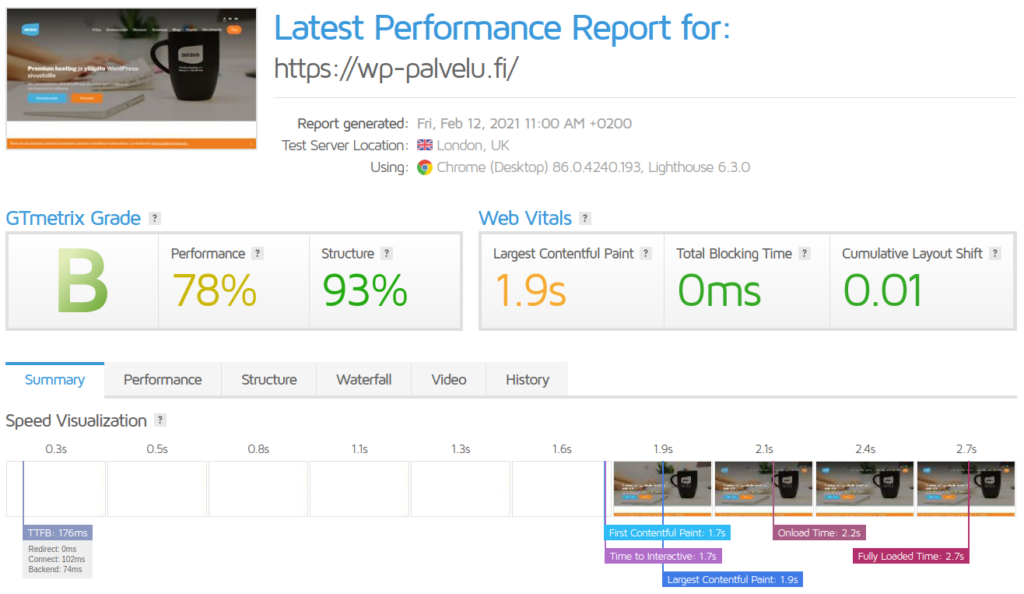
GTmetrix underwent a major change in November 2020, when it started using Lighthouse, the same engine as Google PageSpeed Insights test. At the same time, Web Vitals values were added to the speed report results.
Tools available in Seravo’s environment
wp-speed-test – This tool operates over SSH connection, measuring how long it takes for the PHP process to generate the HTML code for the front page. The tool can also be run in the WordPress dashboard (wp-admin). Instructions for this tool can be found in the Seravo developer documentation.
wp-check-http-cache – A tool to check whether or not the HTTP cache is working. Returns any cookies and/or header information that clutter the HTTP cache. Can also be run in the WordPress dashboard (wp-admin).
Tools for advanced users
Tideways – Our service has an integration for the Tideways tool. With Tideways, it is possible to map very accurately what a site’s PHP code does, thereby revealing the site’s bottlenecks. See Seravo’s developer documentation for more information.
Comments
2 responses to “Get Started with Speed Optimization of Your WordPress Site”
[…] is also part of search engine optimization, because search engines prefer fast-performing sites. You can have a look at Seravo’s tips for WordPress speed optimization on another blog post of … Speed optimizing large online stores in particular can be challenging, which is why a quality […]
[…] When the amount of HTTP requests stays moderate, it means the site will also perform better. It’s a good idea to keep track of the site’s resources and examine loading times with a speed test if the site doesn’t seem to be loading properly. Speed optimization may offer some tips and tricks which may also lessen the amount of requests. Keep reading to find out how to decrease the amount of HTTP requests on your site – but you might also want to check out our expert tips for getting started with speed tests and speed … […]