
We are proud to announce that at Seravo.com we have implemented an integration with Tideways, a service to log and analyze what your WordPress PHP code is doing. It is a great tool to drill down into the PHP execution and pinpoint the exact line of code that causes your site problems.
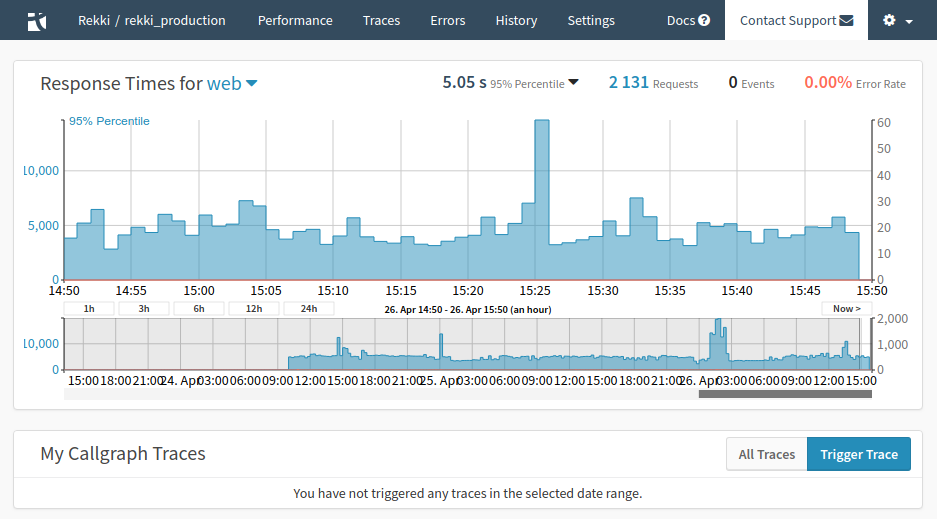
We have had XDebug available since the inception of Seravo.com, but only in development environments. The great thing about Tideways is that it can be used in production. In our integration it will automatically sample 1% of your site’s traffic and cause neglibile performance impact completely unlike how XDebug works. Just like our XDebug instructions, the how to enable Tideways is documented at help.seravo.com/en. Using Tideways is available to all of our customers and you don’t need to pay anything extra to Seravo and you only pay to Tideways for the service level you want. Once you have followed the instructions and activated Tideways (remember to enable PHP 7.2 too!) you will see data flowing into the Tideways dashboard.
How to Find a Bottleneck in WordPress
One of our customers noticed that their WooCommerce product pages took longer to load than expected. The fact was confirmed from the HTTP traffic reports found in the Seravo dashboard under Tools > Reports, which showed that when requests are sorted by the Avg T.S (average time to serve) column, the product pages topped the list. The situation was also easily confirmed and repeatable using the command line tools wp-speed-test and wp-load-test when given the product pages as the test parameter.
Indeed Tideways will automatically profile lots of different page loads and show where there is slowness, but if you have a suspected URL known, you can manually trigger a trace for it. On the main page of a Tideways application dashboard there is the section My Callgraph Traces where you can click Trigger trace. On the view that opens you can under header Using GET-Parameters, copy the custom GET string and append it to the URL you want to analyze and go for it. After some seconds the call trace will show up on Tideways.
Tideways Waterfall View
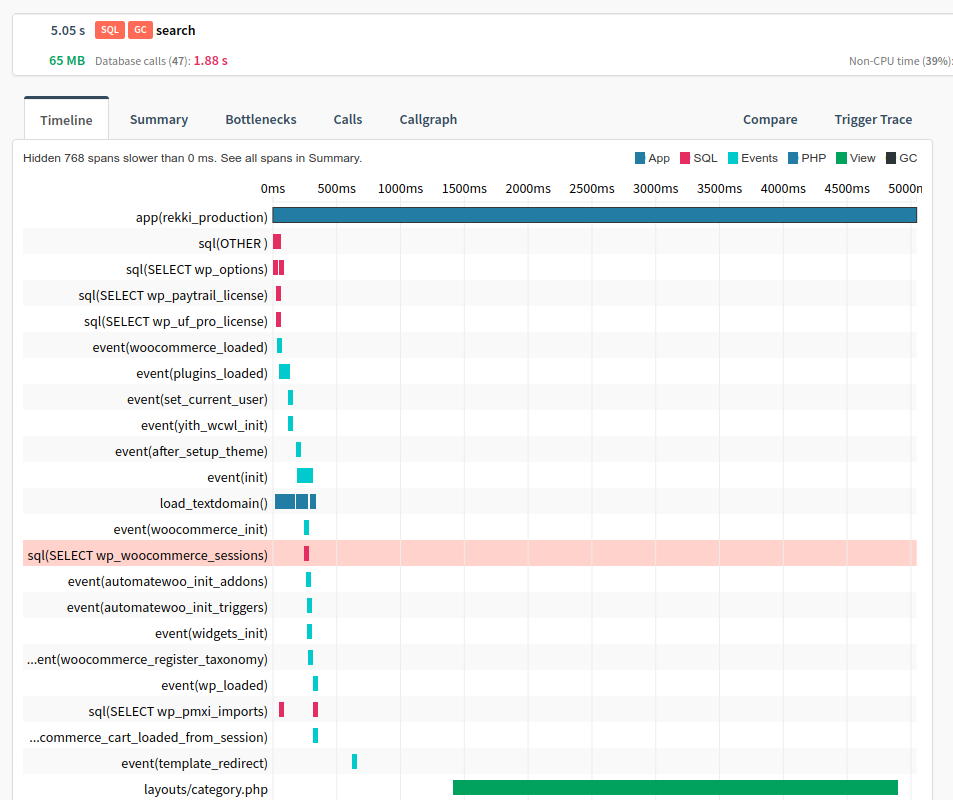
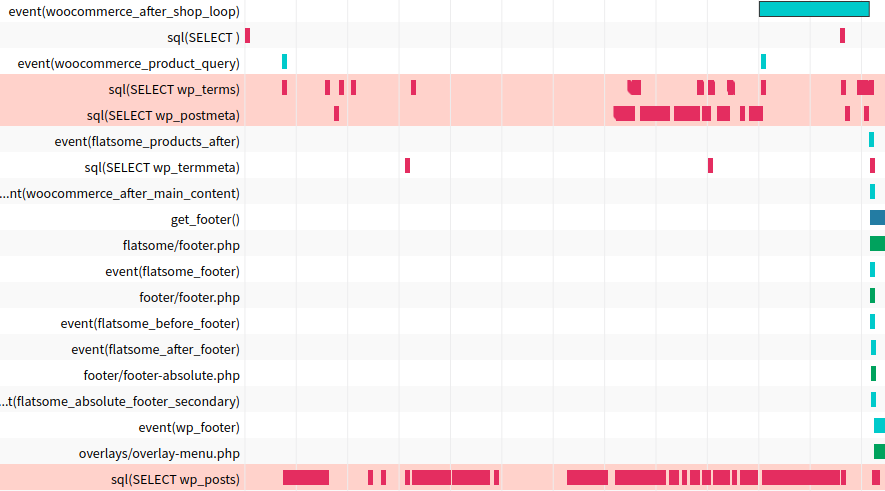
The default view of the trace itself will be a waterfall view. It is an interactive graphic, so you can click on any element and additional information about it will show up in the side panel. The waterfall view is great in visualizing what is going on during the page load. Even if you don’t have a bottleneck, the waterfall view will help you get a sense of what your code does.
In this case, we found that at the end of the page load over a half second is wasted on fetching all posts from the database by the Facebook for WooCommerce plugin, which is most likely unnecessary here.
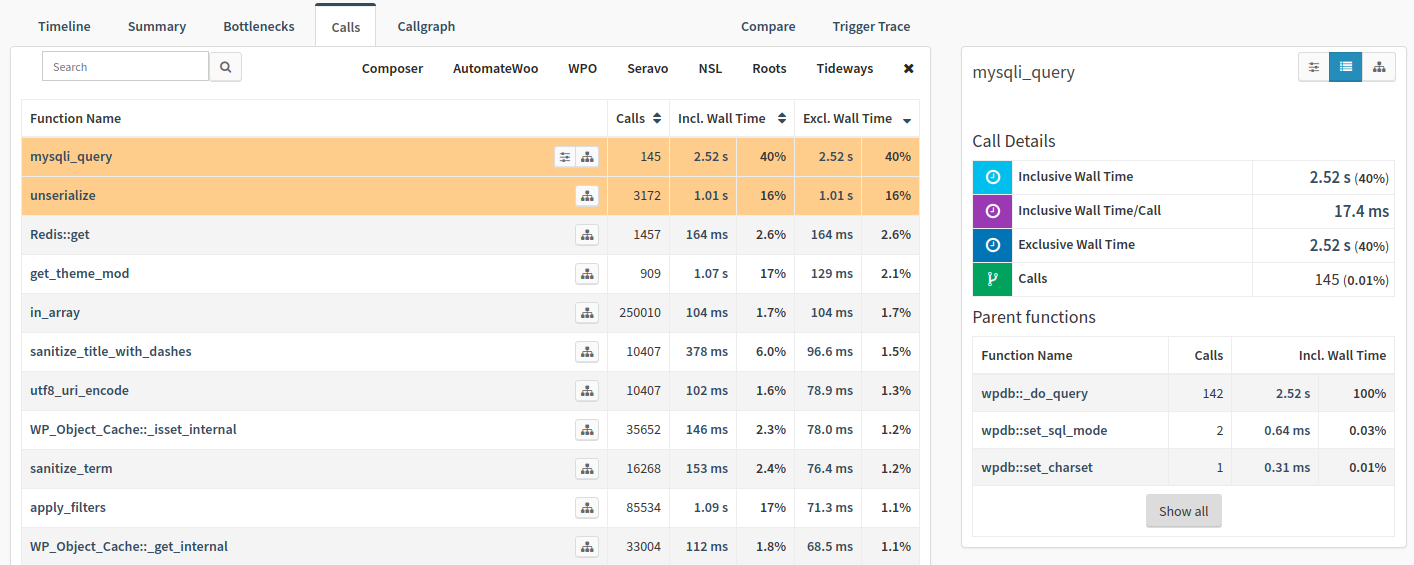
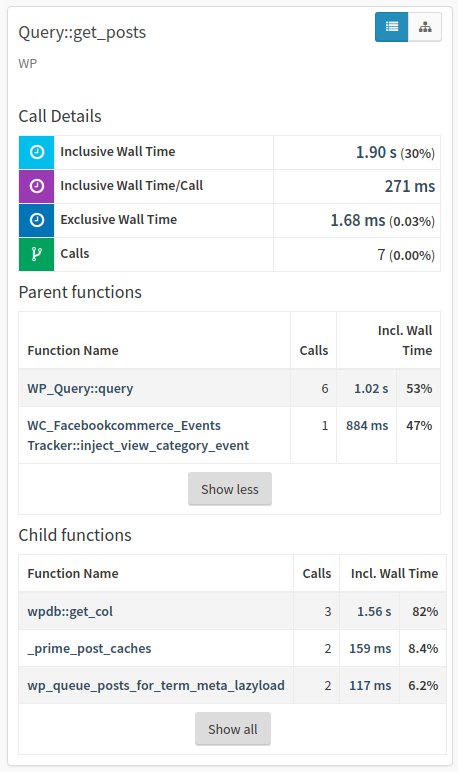
In the tab Calls you can see the function calls represented as a table. By default the table is ordered according to total self time, i.e. how much time was spent in that function. This Calls view is familiar to anybody who has used XDebug. When you click on a function name, additional info will again show up in the sidebar and by clicking on the function names in the sidebar you can drill down to find what piece of code actually generates the waste of time you want to optimize away.
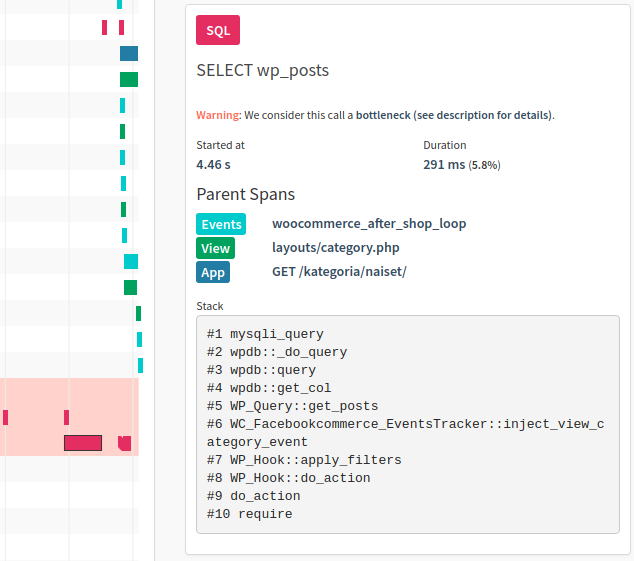
Here we managed to find out that the slowest database call is run in the function called inject_view_category_event.
Once you found the function name, you need to find the code itself. Unlike XDebug, Tideways does not have access to your code so what you need to do, is for example to fire up an SSH shell and run grep to find the suspected function call.
In this example we were able to detect the exact filename and line where the inject_view_category_event function is defined. To optimize it, we need to find rewrite some part of the code inside it.

How to Fix a Slow WordPress
It turned out, that the function above ran $wp_query->get_posts() on every page load, triggering and extra database query to fetch the posts listed on the page (in this case a list of products). It was replaced with $wp_query->posts to reuse the posts (WooCommerce products) already in memory as they had already been fetched in the beginning of the page load before the templates for that view were even loaded.
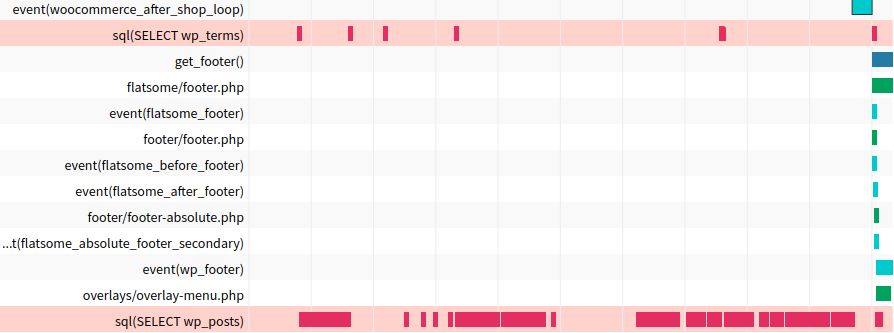
The fix was easy to verify by looking at a new trace where the red bar (representing a slow SQL query) from this location was gone and the parent scope of woocommerce_after_shop_loop length dropped from 1 second to 160 milliseconds.
In this example there are still quite a few unnecessary SQL queries repeated during the same page load but we need to work by fixing one issue at a time. And because WordPress is GPL and most plugins are developed in the open, remember to contribute upstream all fixes you do so that you don’t need to maintain patches yourself, but they are incorporated into the original plugin and included in the next release of it. In this case we sent our improvement to Facebook via Github.
Comments
6 responses to “Debug PHP performance issues with Tideways”
[…] themselves contained a bit of boilerplate code and some simple loops over custom post types. As the Tideways profiling revealed, producing those partials was fairly heavy on the database. As the front page is rather […]
[…] sample and help debug PHP execution slowness and errors is recommended. We’ve written a more in-depth look and case study about Tideways and how to use it, which is especially useful for our customers as a Tideways integration is directly built-in to our […]
[…] tur innehöll viss standardkod och enkla loopar som stegade igenom olika anpassade inläggstyper. Tideways-profileringen visade att hämtandet av dessa delmallar belastade databasen ganska mycket. Med tanke på att […]
[…] we announced Tideways last year it has also gained many new features, and we have updated our integration at Seravo so our […]
[…] hos PHP erbjuder vi även profileringsverktygen XDebug i staging-miljön och en integrering med Tideways för webbplatser i […]
[…] themselves contained a bit of boilerplate code and some simple loops over custom post types. As the Tideways profiling revealed, producing those partials was fairly heavy on the database. As the front page is rather […]