
 - Docs
Profile runtime with Xdebug & Webgrind
Note: Xdebug is only for development sites. Use Tideways on live production websites.
What is Xdebug?
Xdebug is a debugger and profiler for PHP. We mainly use it as profiler and it’s installed in the Vagrant box by default.
Profiling pages with Xdebug and Webgrind
You can profile any page in Vagrant by visiting them and using the ?XDEBUG_PROFILE paramater in the url.
This will generate a new dbkg dump which you can the analyze in your browser using webgrind.
Example: Profile WP admin dashboard
- Enter the Vagrant box with
vagrant sshand inside it runwp-xdebug-onto ensure Xdebug is active. - Visit: http://wordpress.local/wp-admin/?XDEBUG_PROFILE
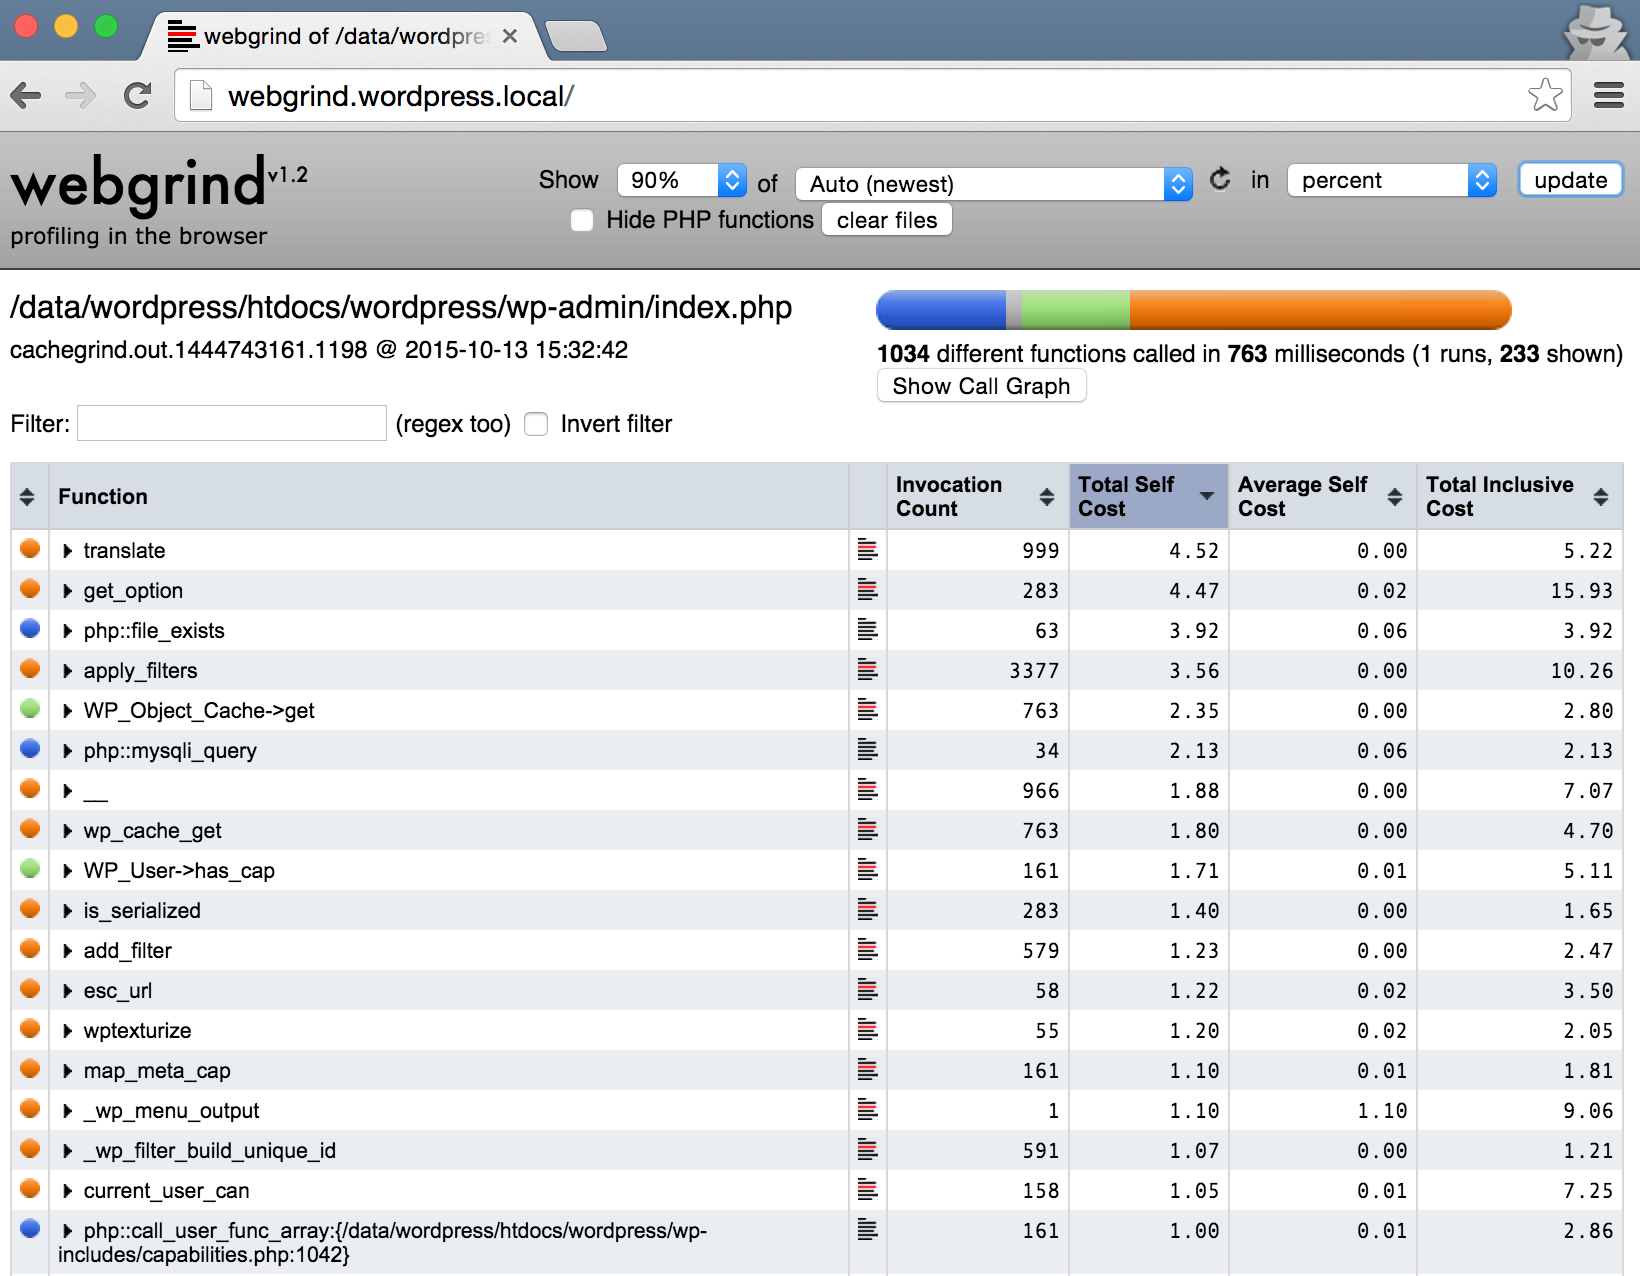
- Visit http://webgrind.wordpress.local/
- Click update button and wait for webgrind to analyze the dump.
- You can see the profiling of the admin page and look up slow functions which you can then optimize.
Using the Xdebug Helper Chrome extension
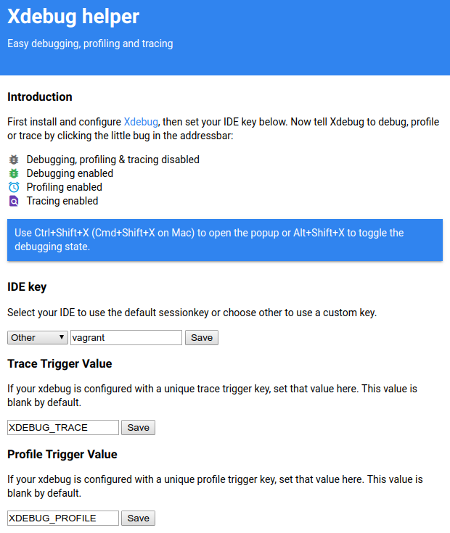
Profiling and traces can easily also be triggered using the Xdebug Helper Chrome extension. For optimal operation use the settings:
- IDE key: vagrant
- Trace Trigger Value: XDEBUG_TRACE
- Profile Trigger Value: XDEBUG_PROFILE
Using remote debugging with Xdebug
Xdebug can also be used for remote live debugging with breakpoints and all. Please refer to your IDE for more information. A good example is the Atom php-debug plugin documentation on the topic.